fbpx

Elevate Your PostgreSQL Skills: The Ultimate Guide to Database Administration Certification

Introduction

PostgreSQL is a robust, open-source database management system renowned for its power and flexibility. As its popularity soars, the demand for skilled PostgreSQL Database Administrators (DBAs) is skyrocketing. Certification is the gold standard that validates your expertise, setting you apart in a competitive job market. In this blog post, we’ll dive into:

  • The Value of PostgreSQL Database Administration Certification
  • Top Certification Programs
  • Exam Preparation Strategies
  • Expert Insights for Success

Why Pursue PostgreSQL Database Administration Certification?

  • Increased Earning Potential: Certified PostgreSQL professionals command higher salaries.
  • Enhanced Credibility: Earn industry recognition and boost your professional reputation.
  • Career Advancement: Certifications open doors to leadership roles and exciting opportunities.
  • Mastery Validation: Demonstrate in-depth PostgreSQL administration skills to employers and clients.

Reputable PostgreSQL Certification Programs

Conquering the PostgreSQL Certification Exam

  • Enroll in Courses: Choose training programs tailored to your preferred certification.
  • Practice, Practice, Practice: Hands-on experience with PostgreSQL administration is essential.
  • Mock Exams: Hone your exam-taking skills and identify areas for improvement with mock tests.
  • Join Online Communities: Get support, ask questions, and learn from fellow PostgreSQL professionals.

Expert Tips for PostgreSQL Certification Success

  • Industry Experience: Real-world experience is invaluable. Work on database projects to solidify your understanding.
  • Study Groups: Form study groups with others preparing for the exam to share knowledge.
  • Know the Exam Blueprint: Understand the exam format and topics covered.
  • Manage Time Wisely: Practice effective time management during the exam.

Conclusion

PostgreSQL Database Administration Certification is a game-changer for your career. By understanding the benefits, choosing the right program, and preparing strategically, you’ll unlock your potential and achieve success in the exciting world of PostgreSQL database administration.
Monitor Database Server using Prometheus & Grafana

Prometheus is an open-source monitoring system that collects metrics from different sources, stores them, and provides a query language and visualization capabilities to analyze and alert on them. It is designed for monitoring distributed systems and microservices architectures, and provides a time-series database to store the collected data.

Grafana is also an open-source data visualization and analytics platform. It allows users to create customizable and interactive dashboards, reports, and alerts for a wide variety of data sources, including Prometheus. Grafana provides a user-friendly interface to explore and analyze the data, and supports various visualization types, such as graphs, tables, and heatmaps. It is often used as a complement to Prometheus, as it enables users to create custom dashboards and alerts based on the collected metrics.

				
					root@ip-172-31-22-198:~/monitroing# cat docker-compose.yml
version: '3.7'
services:
  prometheus:
    image: prom/prometheus:latest
    container_name: prometheus
    volumes:
      - ./prometheus.yml:/etc/prometheus/prometheus.yml
    command:
      - '--config.file=/etc/prometheus/prometheus.yml'
    ports:
      - '9090:9090'

  grafana:
    image: grafana/grafana:latest
    container_name: grafana
    ports:
      - '3000:3000'

  node_exporter:
    image: prom/node-exporter:latest
    container_name: node_exporter
    volumes:
      - /proc:/host/proc:ro
      - /sys:/host/sys:ro
      - /:/rootfs:ro
    command:
      - '--path.procfs=/host/proc'
      - '--path.sysfs=/host/sys'
      - '--collector.filesystem.ignored-mount-points=^/(sys|proc|dev|host|etc)($$|/)'
    ports:
      - '9100:9100'


root@ip-172-31-22-198:~/monitroing# cat prometheus.yml
global:
  scrape_interval: 15s

scrape_configs:
  - job_name: 'prometheus'
    static_configs:
      - targets: ['localhost:9090']

  - job_name: 'node_exporter'
    static_configs:
      - targets: ['node_exporter:9100']


The Docker Compose file defines three containers: prometheus, grafana, and node_exporter. The Prometheus configuration file specifies the global scrape interval and the targets for two jobs: prometheus and node_exporter.

The prometheus container runs the Prometheus server, and mounts the prometheus.yml file into the container as its configuration file. The container is exposed on port 9090 and mapped to the same port on the host machine (localhost:9090).

The grafana container runs the Grafana server, and is exposed on port 3000. Grafana is a popular open-source visualization platform that is often used with Prometheus to create custom dashboards and visualizations.

The node_exporter container runs the Prometheus node_exporter service, which collects system metrics from the host machine and makes them available to Prometheus. The container is exposed on port 9100 and mapped to the same port on the host machine (node_exporter:9100).

Overall, this Docker Compose file and Prometheus configuration should set up a basic monitoring stack that collects system metrics from the host machine using node_exporter, stores them in Prometheus, and allows you to visualize them using Grafana.

To start the Docker Compose stack defined in your docker-compose.yml file, you can use the docker-compose up command in the directory where the file is located.

Here are the steps to do this:

  1. Open a terminal window and navigate to the directory where your docker-compose.yml file is located (~/monitroing in your case).

  2. Run the following command:

    docker-compose up
  • This will start all the containers defined in the docker-compose.yml file and output their logs to the terminal window.

  • Once the containers are running, you should be able to access the Prometheus server at http://localhost:9090 and the Grafana server at http://localhost:3000.

    Note that the node_exporter container is not directly accessible from the host machine, but its metrics should be available to Prometheus via its internal network.

  • To stop the containers, press Ctrl+C in the terminal window where you ran the docker-compose up command. This will stop and remove all the containers.

    If you want to stop the containers without removing them, you can use the docker-compose stop command. To start the containers again after stopping them, you can use the docker-compose start command.

Nextcloud Docker compose

You can easily make your nextcloud system at home using a few easy and simple steps. NextCloud is an open-source cloud-making platform with all the features like google cloud and Microsoft One Drive. Just take the docker to compose code and execute it with simple commands. And your nextcloud is ready to rock.

				
					services:
  nextcloud:
    image: nextcloud
    ports:
      - 8080:80
    volumes:
      - nextcloud:/var/www/html
    environment:
      - MYSQL_HOST=database
      - MYSQL_USER=nextcloud
      - MYSQL_PASSWORD=nextcloud
      - MYSQL_DATABASE=nextcloud
    depends_on:
      - database

  database:
    image: mariadb
    environment:
      - MYSQL_ROOT_PASSWORD=rootpassword
      - MYSQL_USER=nextcloud
      - MYSQL_PASSWORD=nextcloud
      - MYSQL_DATABASE=nextcloud
    volumes:
      - database:/var/lib/mysql

volumes:
  nextcloud:
  database:


Prometheus and Grafana Docker Compose

Here is a sample Docker Compose file that you can use to set up Prometheus and Grafana using Docker:

				
					version: '3'

services:
  prometheus:
    image: prom/prometheus:latest
    volumes:
      - ./prometheus/config:/etc/prometheus
      - ./prometheus/data:/prometheus
    ports:
      - "9090:9090"
  grafana:
    image: grafana/grafana:latest
    volumes:
      - ./grafana/data:/var/lib/grafana
      - ./grafana/config:/etc/grafana
    ports:
      - "3000:3000"
    depends_on:
      - prometheus


This Docker Compose file defines two services: Prometheus and Grafana. It specifies the Docker images to use for each service and maps the necessary ports to enable communication between the services. It also defines volumes for storing the configuration files and data for each service.

To use this Docker Compose file, save it to a file (e.g., docker-compose.yml) and run the following command:

				
					docker-compose up


This will start the Prometheus and Grafana containers and bring up the monitoring stack. You can then access Grafana by visiting http://localhost:3000 in your web browser.

I hope this helps! Let me know if you have any questions.

Docker Compose For ELK Stack

Here is a sample Docker Compose file that you can use to set up the Elastic stack (also known as the ELK stack) using Docker:

				
					version: '3'

services:
  elasticsearch:
    image: docker.elastic.co/elasticsearch/elasticsearch:7.10.0
    environment:
      - discovery.type=single-node
    volumes:
      - elasticsearch-data:/usr/share/elasticsearch/data
    ports:
      - "9200:9200"
      - "9300:9300"
  logstash:
    image: docker.elastic.co/logstash/logstash:7.10.0
    volumes:
      - ./logstash/config:/usr/share/logstash/config
    ports:
      - "9600:9600"
      - "5000:5000"
  kibana:
    image: docker.elastic.co/kibana/kibana:7.10.0
    ports:
      - "5601:5601"

volumes:
  elasticsearch-data:


This Docker Compose file defines three services: Elasticsearch, Logstash, and Kibana. It specifies the Docker images to use for each service and maps the necessary ports to enable communication between the services. It also defines a volume for Elasticsearch data to ensure that data is persisted across container restarts.

To use this Docker Compose file, save it to a file (e.g., docker-compose.yml) and run the following command:

				
					docker-compose up


This will start the Elasticsearch, Logstash, and Kibana containers and bring up the ELK stack. You can then access Kibana by visiting http://localhost:5601 in your web browser.

I hope this helps! Let me know if you have any questions.

Running MongoDB on Docker Compose

In this article, we will discuss how DBA can run a MongoDB instance using docker-compose. It’s very easy and quite flexible to handle. According to my opinion docker-compose removes all the installation and configuration pain when you need a test instance immediately. In a non-production environment for proof of concepts (POC) environment, you can easily use MongoDB on docker-compose.


High-Level Steps for Installation & Configuration

  • Install Docker 
  • Install Docker compose
  • Take the docker-compose code with MongoDB 
  • Run the docker-compose 
  • Connect to MongoDB Database
  • Connect From MongoDB from Docker bash

Prerequisites

mkdir -p /opt/docker_com_repo

cd /opt/docker_com_repo

vi docker-compose.yml

Copy Below docker compose code for MongoDB and paste in side the docker-compose.yml


IMP: Remove all the comments with “< abc>” From compose code

mkdir -p  /opt/mongo/datafiles/db

mkdir  -p /opt/mongo/configfiles

Docker Compose Code

version: ‘3.3’   
services:
mongodb_container:
container_name: mongodb4.0                                                                 
image: mongo:4.0                                                                                          < Container Image>
environment:
MONGO_INITDB_DATABASE: thedbadmin                                             
MONGO_INITDB_ROOT_USERNAME: root                                                < Database Admin username>
MONGO_INITDB_ROOT_PASSWORD: oracle                                          < Database Admin Password>
ports:
– 27017:27017                                                                                                     
volumes:
– /opt/mongo/datafiles/db:/data                                                     < Persistent Volume for Data files>
– /opt/mongo/configfiles:/etc/mongod                                          < Persistent volume for MongoDB configuration file>

Ruing Docker Compose

cd /opt/docker_com_repo

docker-compose up -d

Check if the MongoDB instance started?

[root@master01 mongodb]# docker-compose ps
Name Command State Ports
———————————————————————————————–
mongodb4.0 docker-entrypoint.sh mongod Up 0.0.0.0:27017->27017/tcp,:::27017->27017/tcp

Test Database connection

[root@master01 mongodb]# telnet localhost 27017
Trying ::1…
Connected to localhost.
Escape character is ‘^]’.

if looks good than go for the next step or stop the Linux firewall 

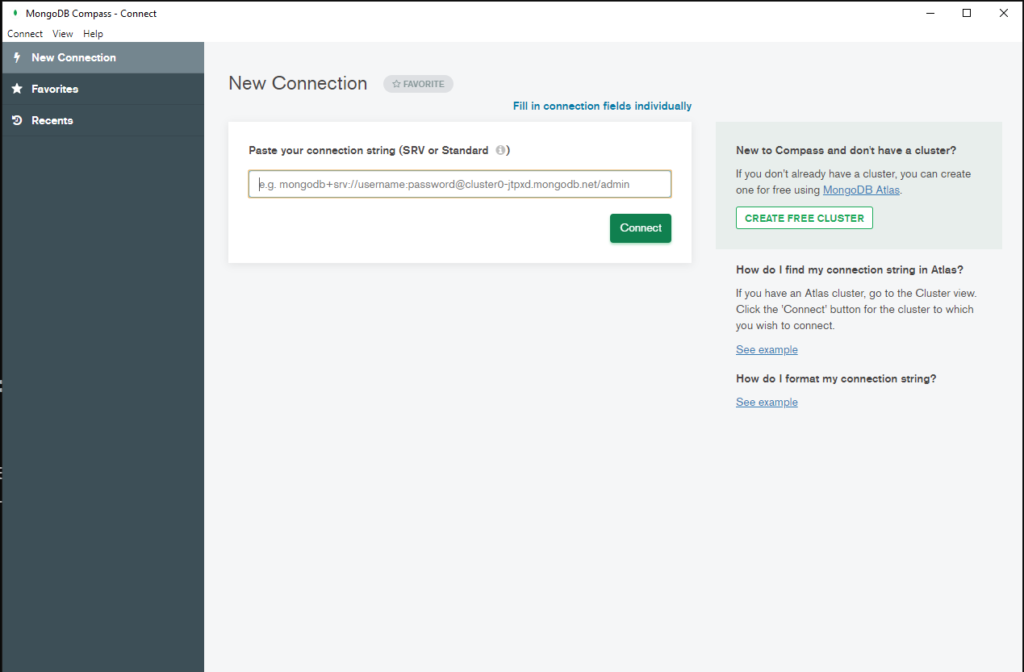
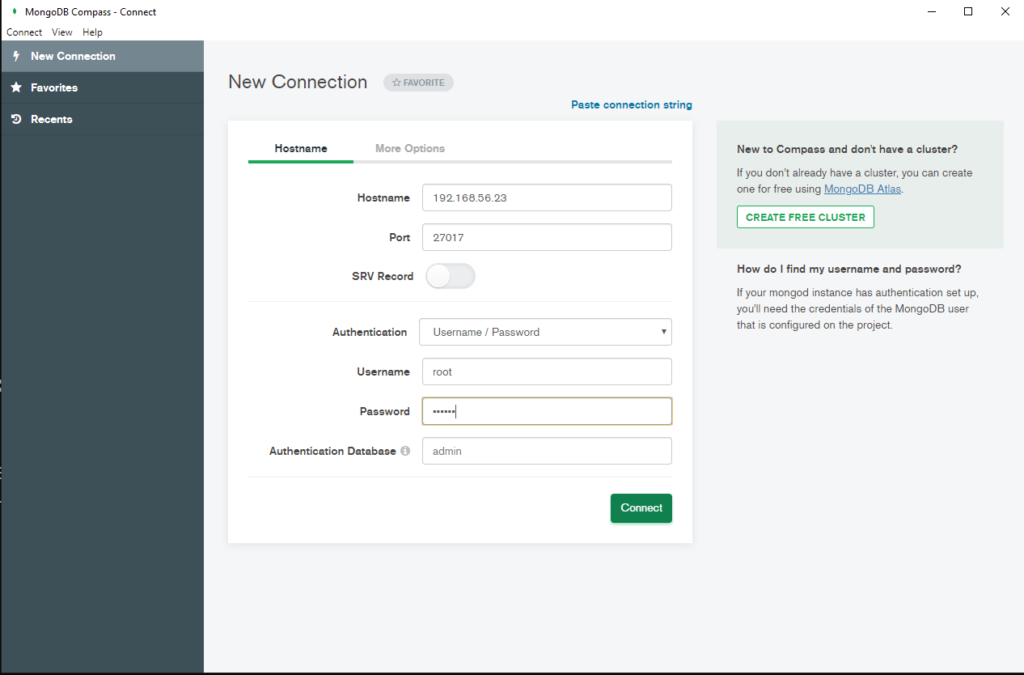
Open MongoDB compass and connect to Database. Follow the screenshots 

Click on “Fill in connection Fields individually

Change the hostname as per your server or machine

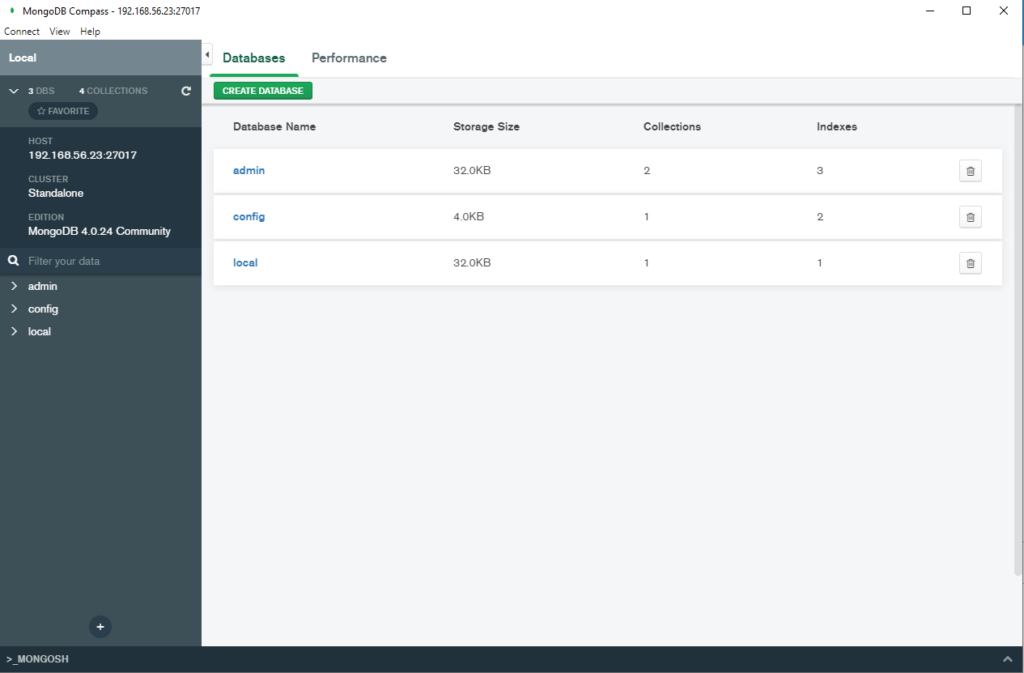
You can hit Create database and start using MongoDB

Connect MongoDB from the command Line 

[root@master01 mongodb]# docker exec -it mongodb4.0 bash

root@58054f03c382:/# mongo -u root -p
MongoDB shell version v4.0.24
Enter password:
connecting to: mongodb://127.0.0.1:27017/?gssapiServiceName=mongodb
Implicit session: session { “id” : UUID(“0d7bb9a1-9549-491c-89c3-dfc9caab7547”) }
MongoDB server version: 4.0.24
Server has startup warnings:
2021-10-02T09:05:13.292+0000 I CONTROL [initandlisten]
2021-10-02T09:05:13.293+0000 I CONTROL [initandlisten] ** WARNING: /sys/kernel/mm/transparent_hugepage/enabled is ‘always’.
2021-10-02T09:05:13.293+0000 I CONTROL [initandlisten] ** We suggest setting it to ‘never’
2021-10-02T09:05:13.293+0000 I CONTROL [initandlisten]
2021-10-02T09:05:13.293+0000 I CONTROL [initandlisten] ** WARNING: /sys/kernel/mm/transparent_hugepage/defrag is ‘always’.
2021-10-02T09:05:13.293+0000 I CONTROL [initandlisten] ** We suggest setting it to ‘never’
2021-10-02T09:05:13.293+0000 I CONTROL [initandlisten]

Enable MongoDB’s free cloud-based monitoring service, which will then receive and display
metrics about your deployment (disk utilization, CPU, operation statistics, etc).

The monitoring data will be available on a MongoDB website with a unique URL accessible to you
and anyone you share the URL with. MongoDB may use this information to make product
improvements and to suggest MongoDB products and deployment options to you.

To enable free monitoring, run the following command: db.enableFreeMonitoring()
To permanently disable this reminder, run the following command: db.disableFreeMonitoring()

> show databases;
admin 0.000GB
config 0.000GB
local 0.000GB

Stay Tuned For latest Database, Cloud & Technology Trends

Read More >>